Delivery locations
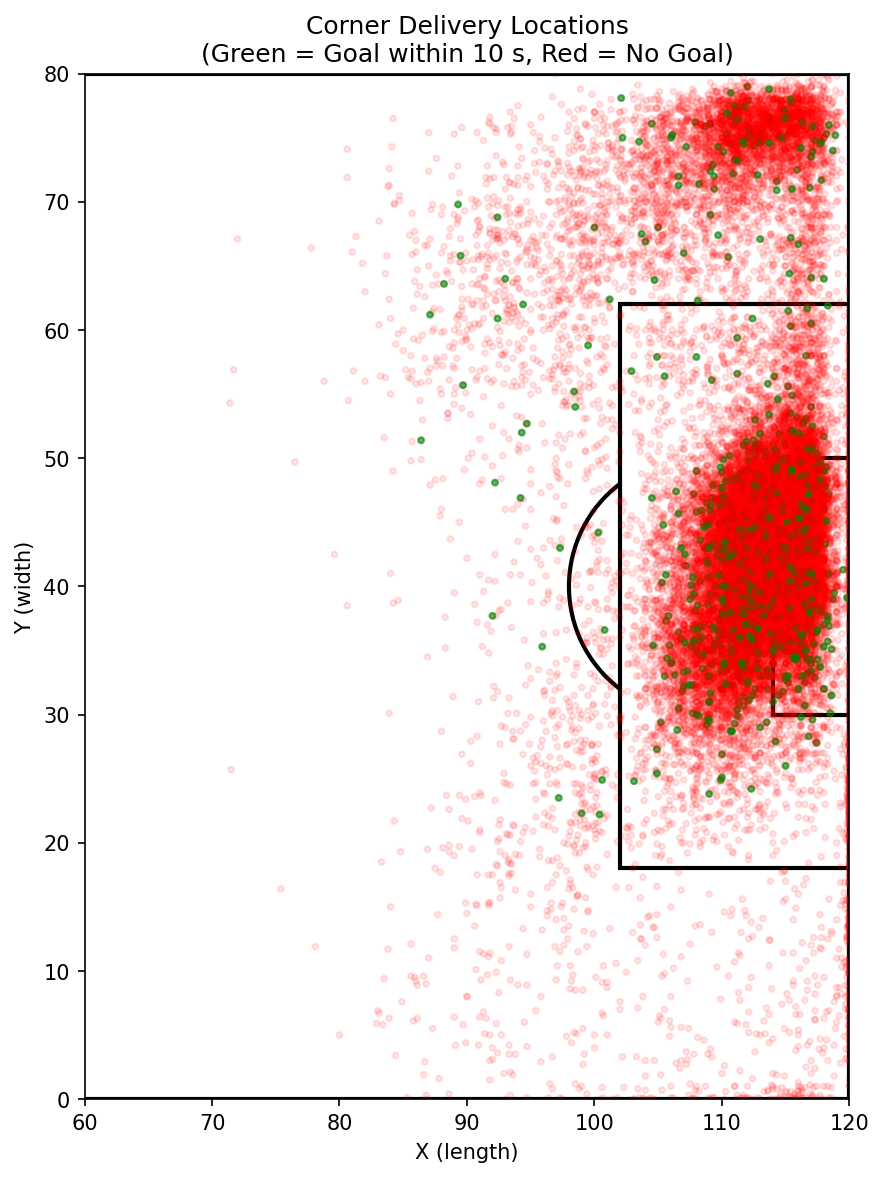 All delivery endpoints. Green = goal within 10 s, red = no goal. Successful deliveries concentrate near the back post of the six-yard box.
Where should you aim a corner kick? Using StatsBomb open event data, every delivery is mapped onto a 120×80 pitch and statistical testing identifies which zones produce a meaningful improvement over the 2.9% baseline success rate.
Corner kick events from StatsBomb open data. A success is defined as a goal within 10 seconds of the corner. All corners taken from the bottom side of the pitch have their Y coordinates mirrored so every delivery is analyzed relative to the same goal. Short corners — where the ball is played to a nearby teammate rather than delivered into the box — are isolated as a separate category.
In soccer, the 18-yard box (penalty area) is the large rectangle in front of goal — roughly the area where most corners are aimed. The 6-yard box (goal area) is the smaller rectangle directly in front of the goal mouth, spanning only the width of the goal plus a few yards on each side. Deliveries into the 6-yard box are riskier to defend because they arrive very close to goal, but harder to aim accurately. The near post is the goalpost closer to where the corner is being taken; the back post (far post) is the one farther away. Back-post deliveries are harder for goalkeepers to reach and give attackers a run-up toward goal.
Zones follow the framework from Casal et al. (2019), dividing the attacking end of the pitch into nine named regions based on X (depth) and Y (width) coordinates on a 120×80 pitch. Zone names use a letter prefix for area (G = goal area / 6-yard box, C = central 18-yard box, F = front, B = back) and a number for position across the width (1 = near post, 2 = center, 3 = back post).
| Zone | Description | X | Y |
|---|---|---|---|
| GA3 | 6-yard box, back/far post | 114–120 | 30–36 |
| GA2 | 6-yard box, center | 114–120 | 36–44 |
| GA1 | 6-yard box, near post | 114–120 | 44–50 |
| CA3 | 18-yard box, back/far post | 108–114 | 30–36 |
| CA2 | 18-yard box, center | 108–114 | 36–44 |
| CA1 | 18-yard box, near post | 108–114 | 44–50 |
| FZ | Front of 18-yard box, near-post side | 102–120 | 50–62 |
| BZ | Front of 18-yard box, back-post side | 102–120 | 18–30 |
| Edge | Edge of 18-yard box, central | 100–108 | 30–50 |
All delivery endpoints. Green = goal within 10 s, red = no goal. Successful deliveries concentrate near the back post of the six-yard box.
| Delivery type | Count | Success rate |
|---|---|---|
| In box | 27,215 | 3.19% |
| Out of box | 6,831 | 1.73% |
Chi-squared p = 1.53×10⁻¹⁰ — in-box deliveries significantly outperform out-of-box deliveries.
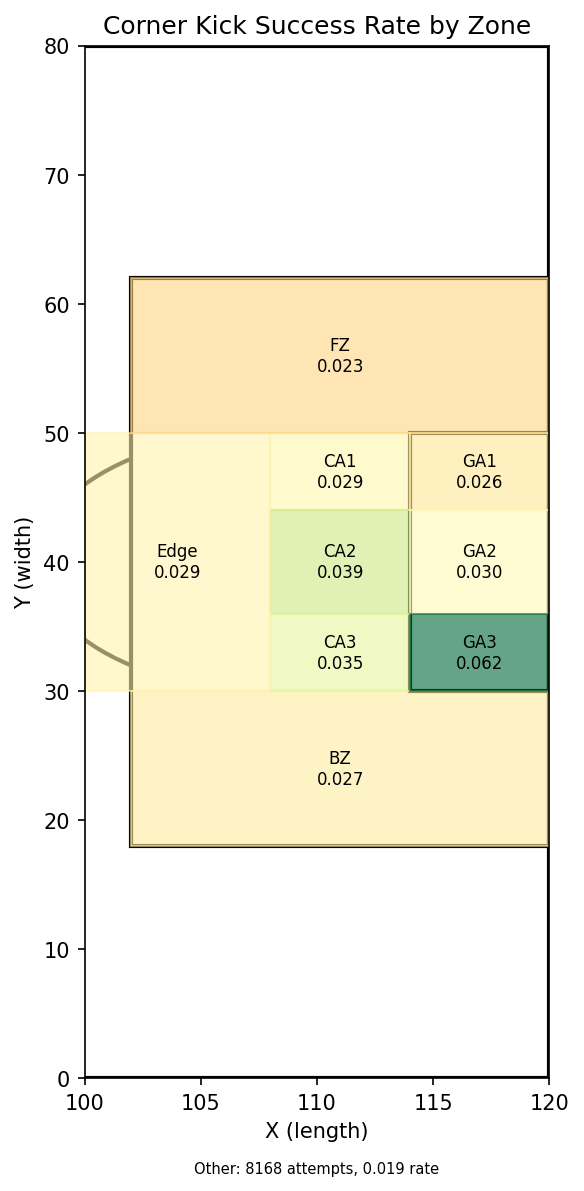 GA3 (back post, six-yard box) leads at 6.2% — more than double any other zone and the only zone to test as statistically significant.
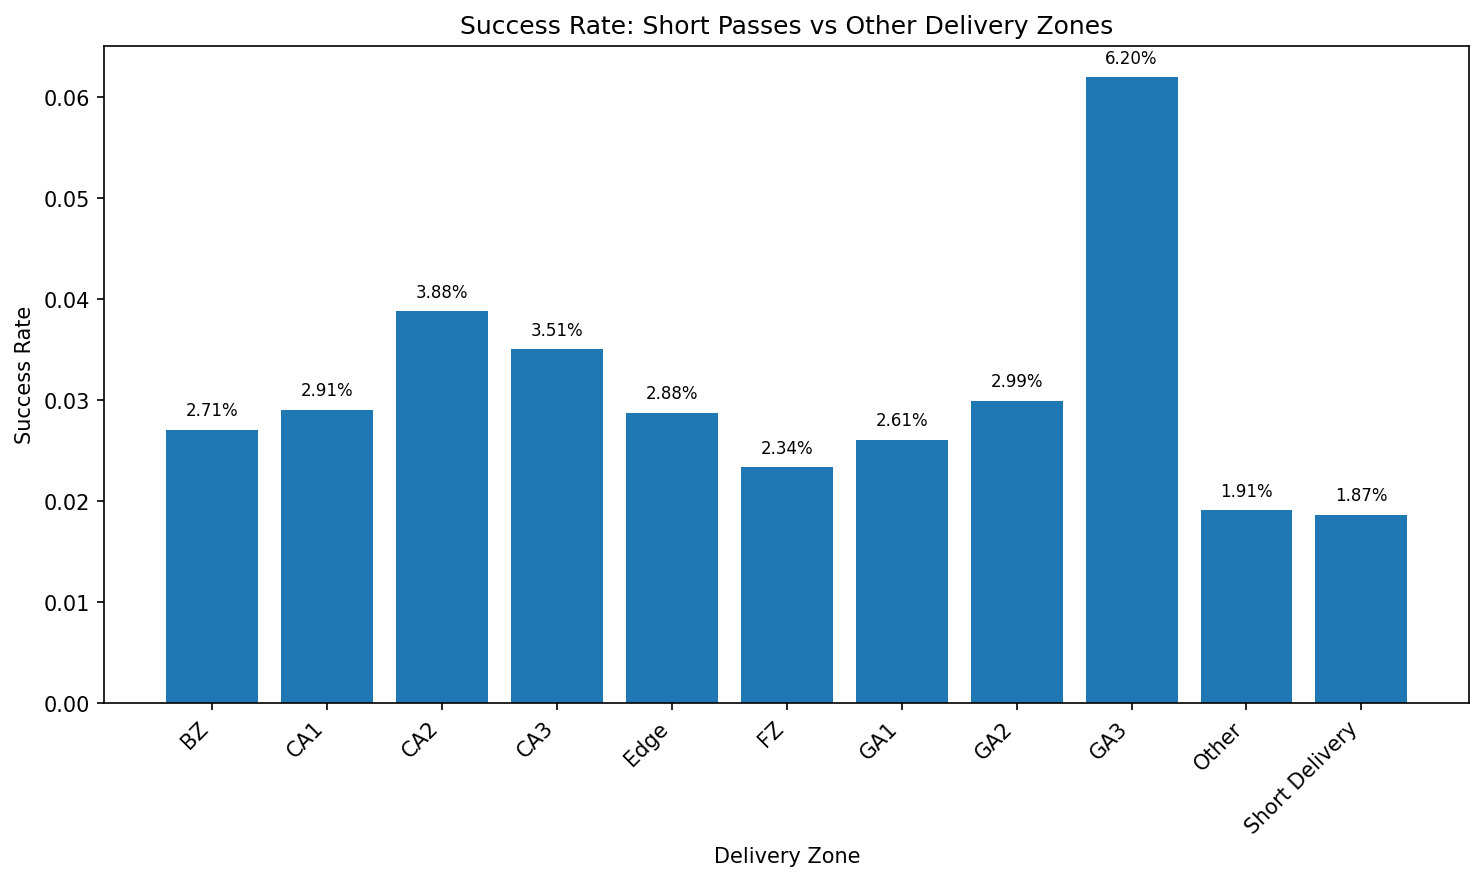 Short corner deliveries (1.87%) underperform every named in-box zone and fall below the overall baseline — the worst strategy across all scenarios.
| Zone | Swing | Count | Success rate |
|---|---|---|---|
| GA3 | inswinging | 329 | 6.99% |
| GA3 | outswinging | 542 | 5.72% |
| CA3 | inswinging | 717 | 4.32% |
| CA2 | outswinging | 4,041 | 4.31% |
| Edge | inswinging | 421 | 3.56% |
| GA2 | inswinging | 1,774 | 3.27% |
GA3 inswinging vs all others: z = 4.451, p < 0.0001. The zone × swing type interaction model shows no significant interaction effects — GA3 leads under both swing types.
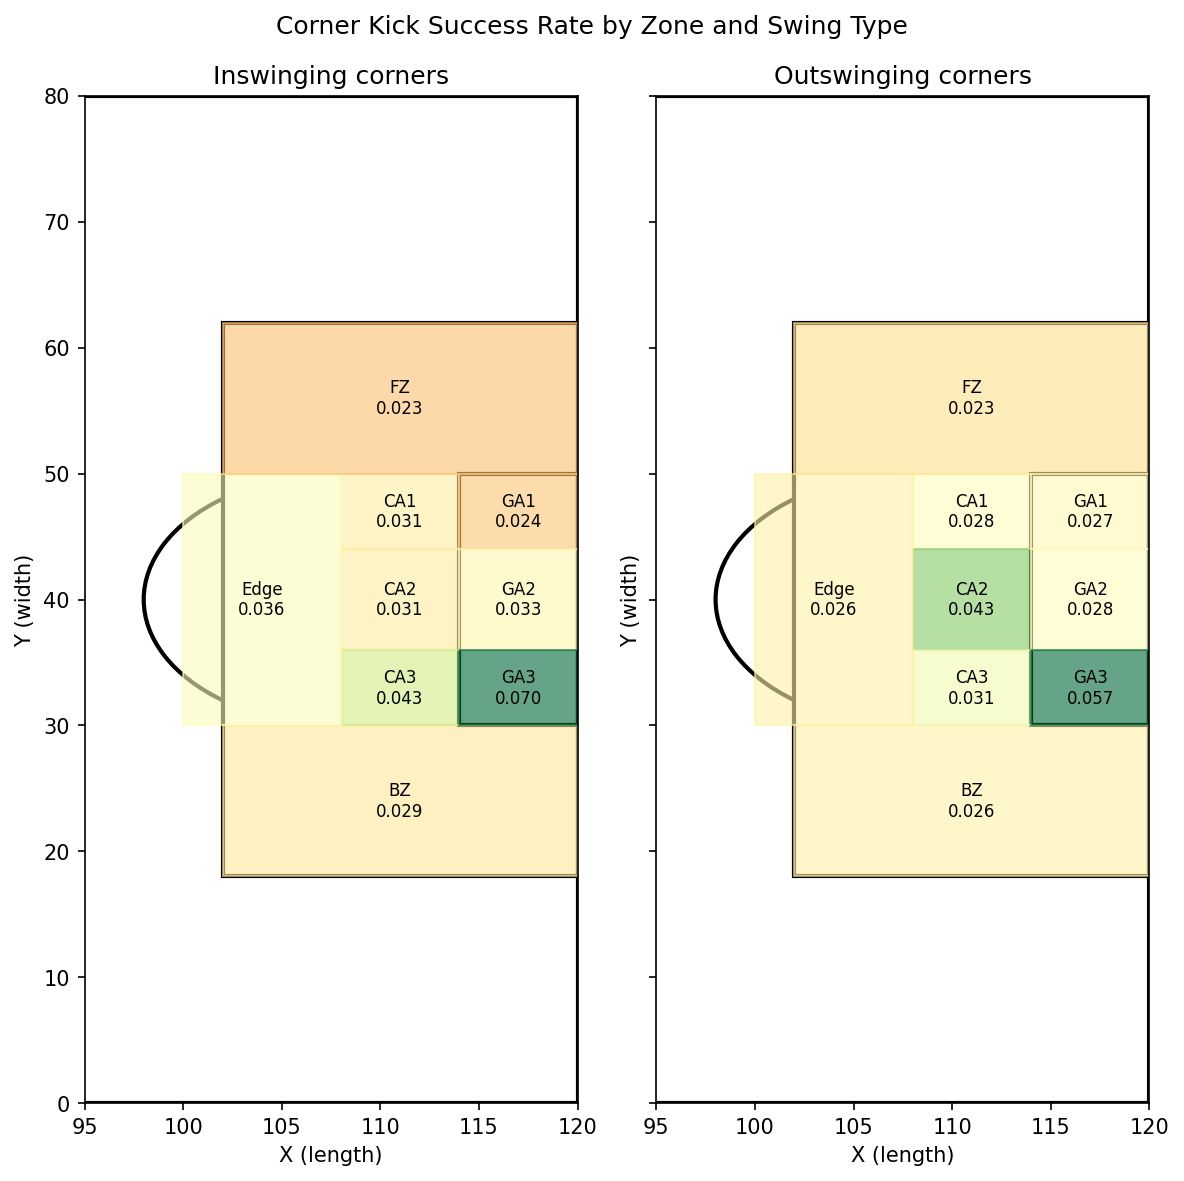 GA3 tops both halves — 7.0% inswinging, 5.7% outswinging. No other zone is consistently strong across swing types.
Two logistic models were fitted — main effects (zone + swing type) and interactions (zone × swing type). In both, only the GA3 coefficient is statistically significant. All other zones and swing type show no significant independent effect on success probability.
| Term | Coef | p-value |
|---|---|---|
| Intercept (BZ baseline) | −3.557 | < 0.001 |
| GA3 | +0.864 | < 0.001 |
| CA2 | +0.373 | 0.075 |
| CA3 | +0.266 | 0.252 |
| Outswinging | −0.038 | 0.579 |
Degree-9 polynomial fits on binned success rates across end_x and end_y coordinates narrow the optimal delivery point to approximately x ≈ 113, y ≈ 33 — deep into the six-yard box, back-post side.
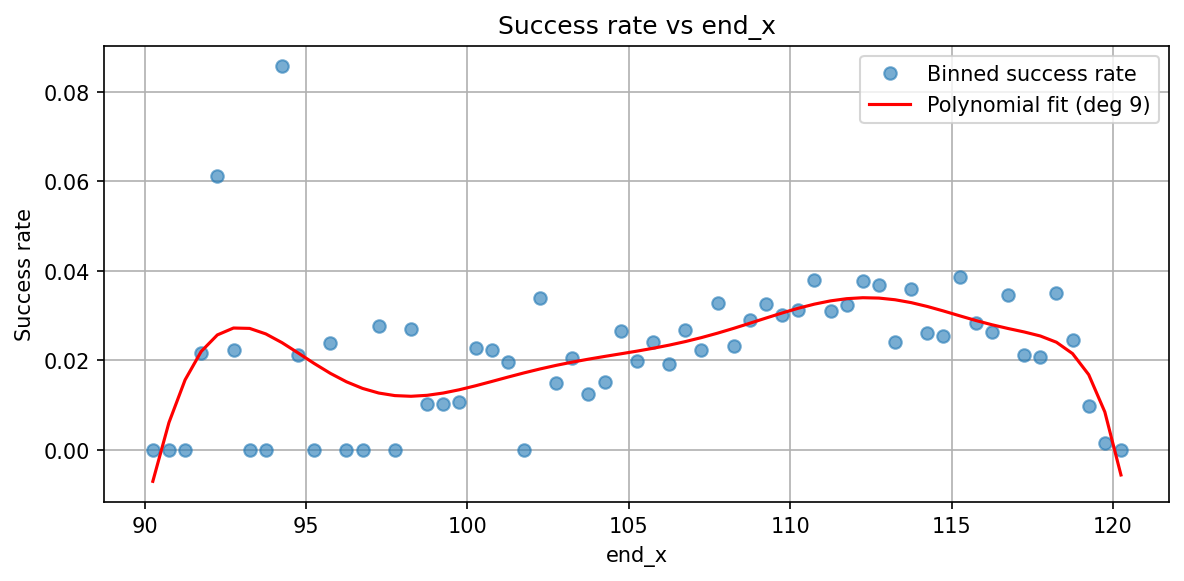 Success rate vs end X. Polynomial fit peaks near x ≈ 113.
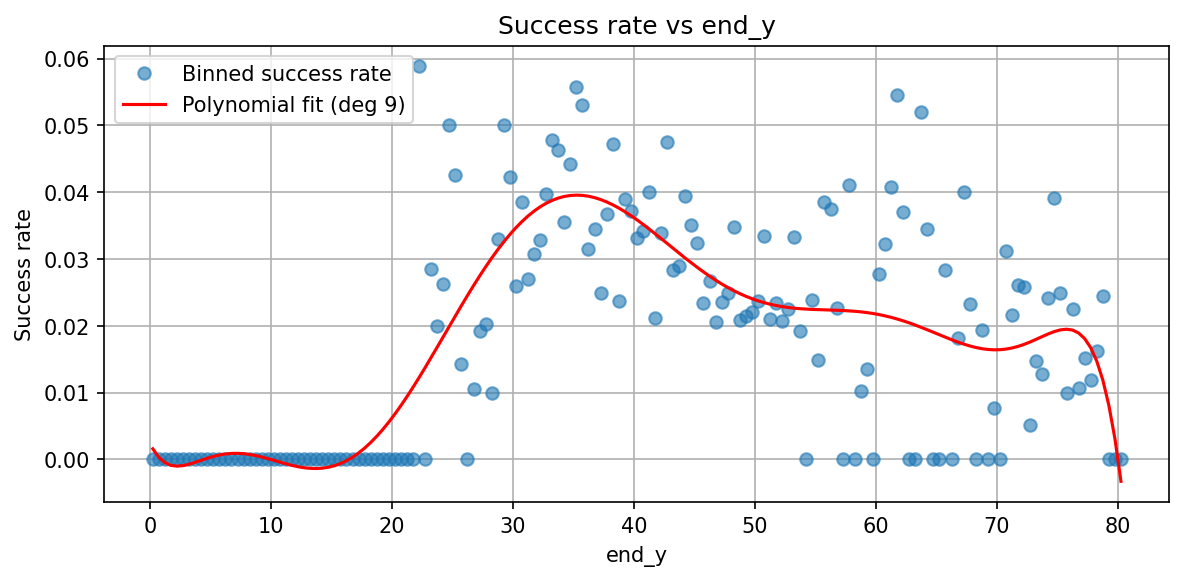 Success rate vs end Y. Polynomial fit peaks near y ≈ 33 — back-post side.
Headers at the far post dominate successful outcomes. Non-header contacts (chest, foot) consistently underperform regardless of zone or swing type.
| Post | Swing | Body part | Count | Rate |
|---|---|---|---|---|
| Far post | outswinging | Head | 2,485 | 8.61% |
| Far post | inswinging | Head | 1,378 | 8.35% |
| Near post | inswinging | Head | 1,042 | 8.06% |
| Near post | outswinging | Head | 1,897 | 7.33% |
| Near post | outswinging | Other | 4,793 | 1.79% |
| Far post | outswinging | Other | 12,146 | 1.48% |